
Reading a Chromatogram: Peaks, Baseline, and Integration
A research-focused guide to the basic visual features of chromatograms and the documentation questions they can, and cannot, answer.
A chromatogram is one of the most recognizable pieces of peptide documentation, but it is also one of the easiest to overread. A clean-looking trace can be useful evidence. It is not a complete identity record, a complete composition record, or a substitute for lot traceability. The value of the chromatogram depends on the method, sample, detector, integration choices, and the way the report connects the trace to a specific lot.
In research peptide documentation, chromatograms most often appear in connection with HPLC or related liquid chromatography methods. The basic idea is separation. A sample moves through a column under defined conditions, different components interact with the column and mobile phase differently, and the detector records a signal over time. The resulting trace is a visual record of detector response, not a photograph of the material itself.
What the axes are showing
Most chromatograms place time on the horizontal axis and detector response on the vertical axis. The horizontal position of a peak is commonly called retention time. It reflects when a component reaches the detector under that specific method. The vertical signal reflects detector response, which may be UV absorbance or another method-specific signal. These details matter because different instruments, gradients, columns, wavelengths, flow rates, and solvents can change how the same material appears.
A retention time can support comparison when the method is controlled, but it should not be treated as full identity proof by itself. A peptide and an impurity can sometimes appear near one another. A changed column or gradient can shift a peak. A detector wavelength can emphasize one component and understate another. This is why earlier CRL Journal topics separate purity documentation from identity documentation, especially when comparing HPLC and mass spectrometry.
Peaks, shoulders, and small signals
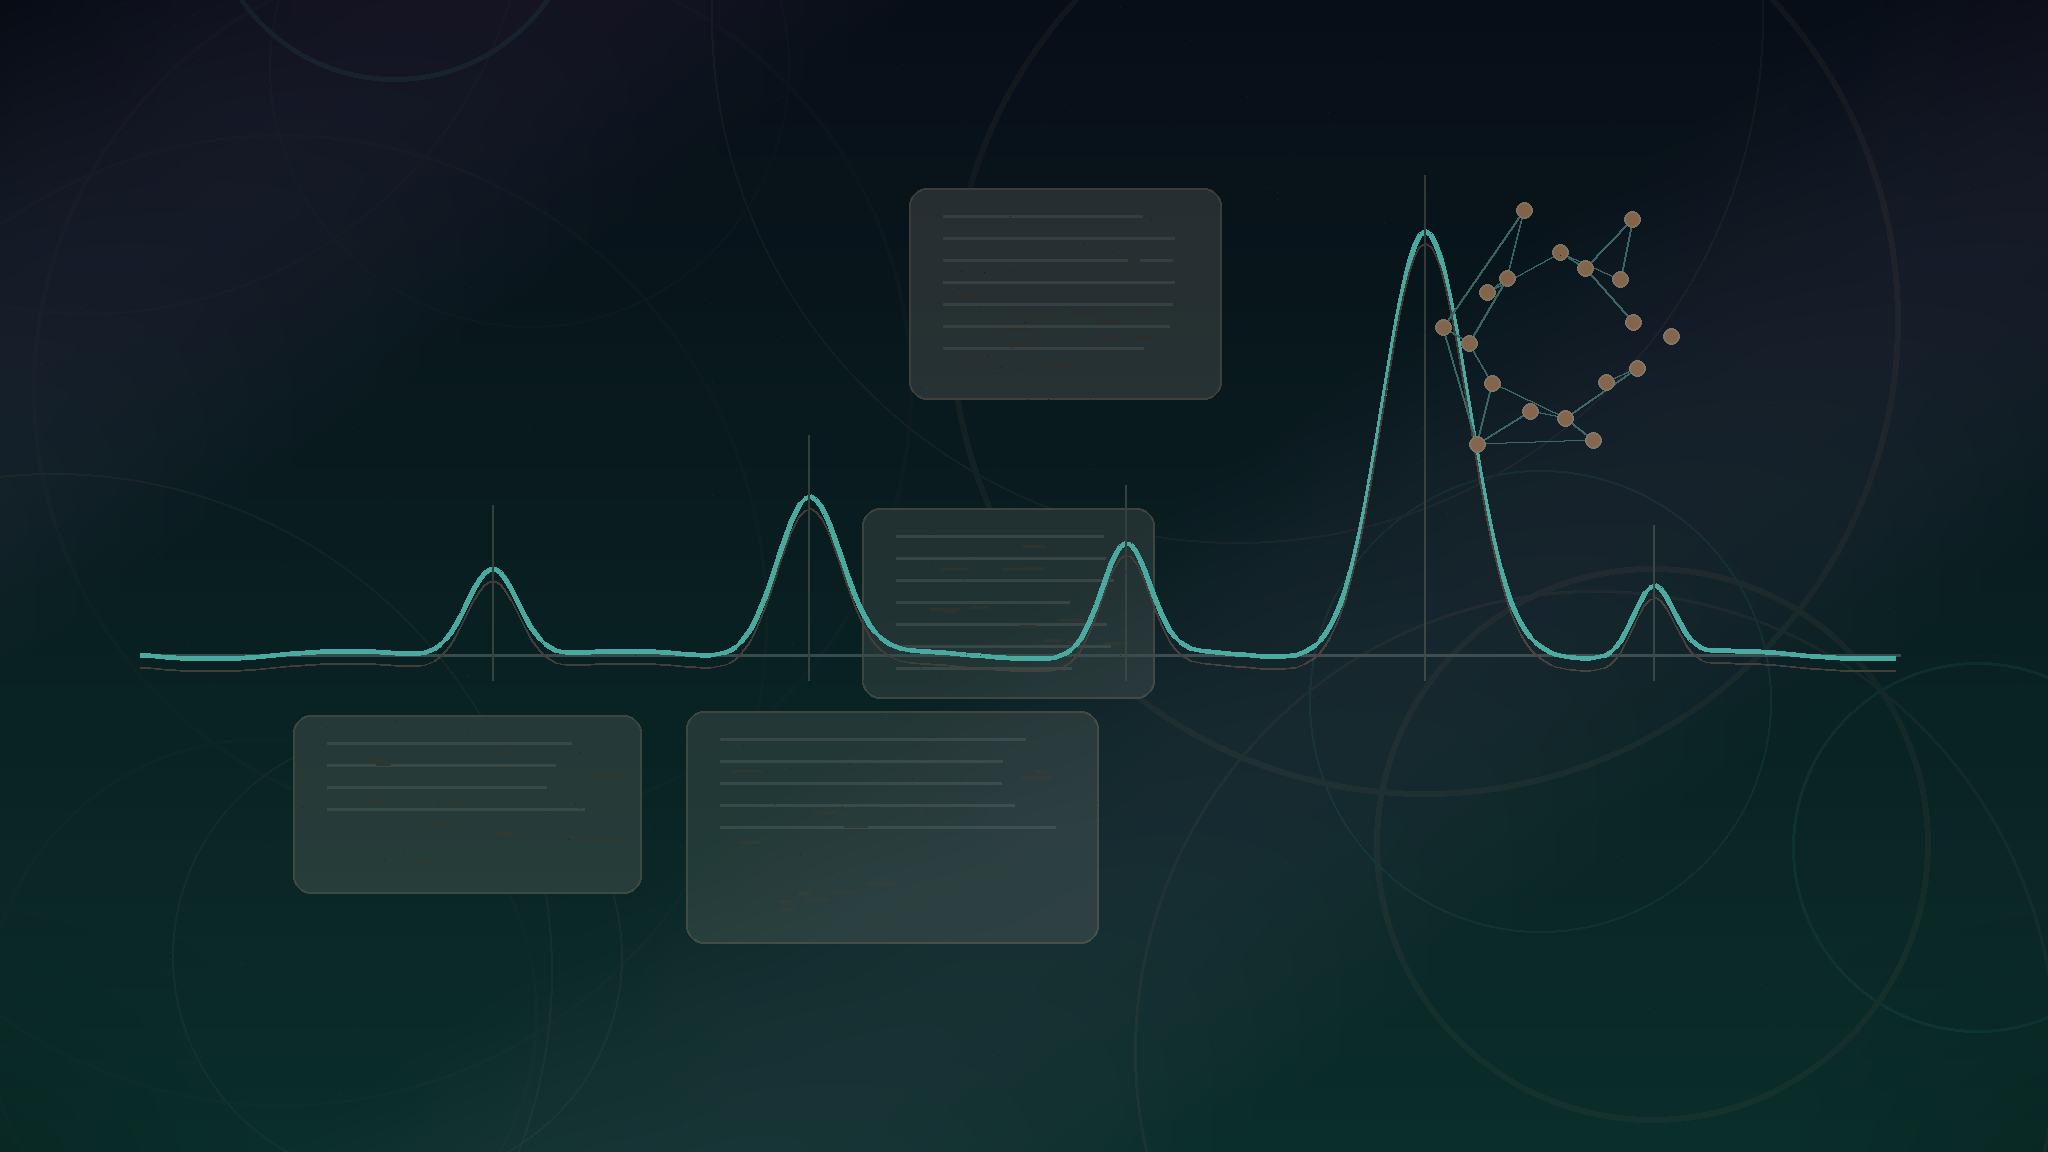
A peak is a rise and fall in detector response associated with material reaching the detector. In a simple educational example, the largest peak may represent the intended peptide and smaller peaks may represent related impurities, truncation products, residual process materials, or other detectable components. Real chromatograms can be more complicated. Peaks may overlap, appear as shoulders, broaden because of method conditions, or sit near the baseline where interpretation is less certain.
Peak shape carries information, but it is not a stand-alone verdict. A sharp symmetrical peak often looks tidy, while tailing, fronting, broadening, or split peaks can point to method issues, sample behavior, column interactions, or more than one component contributing to the signal. Those patterns deserve review, but they still need context. The question is not whether the trace looks attractive; the question is what the method can defensibly show.
Small peaks also require restraint. A small signal may represent a real impurity, a solvent front, a gradient artifact, carryover, noise, or something outside the intended integration window. Analytical teams use method controls, repeatability, blank runs, standards where appropriate, and integration rules to decide how a trace should be interpreted. A supplier summary that presents only one number without the underlying trace and method leaves the reader with less to audit.
The trace is the evidence. The method explains what kind of evidence it is.
Baseline and integration choices
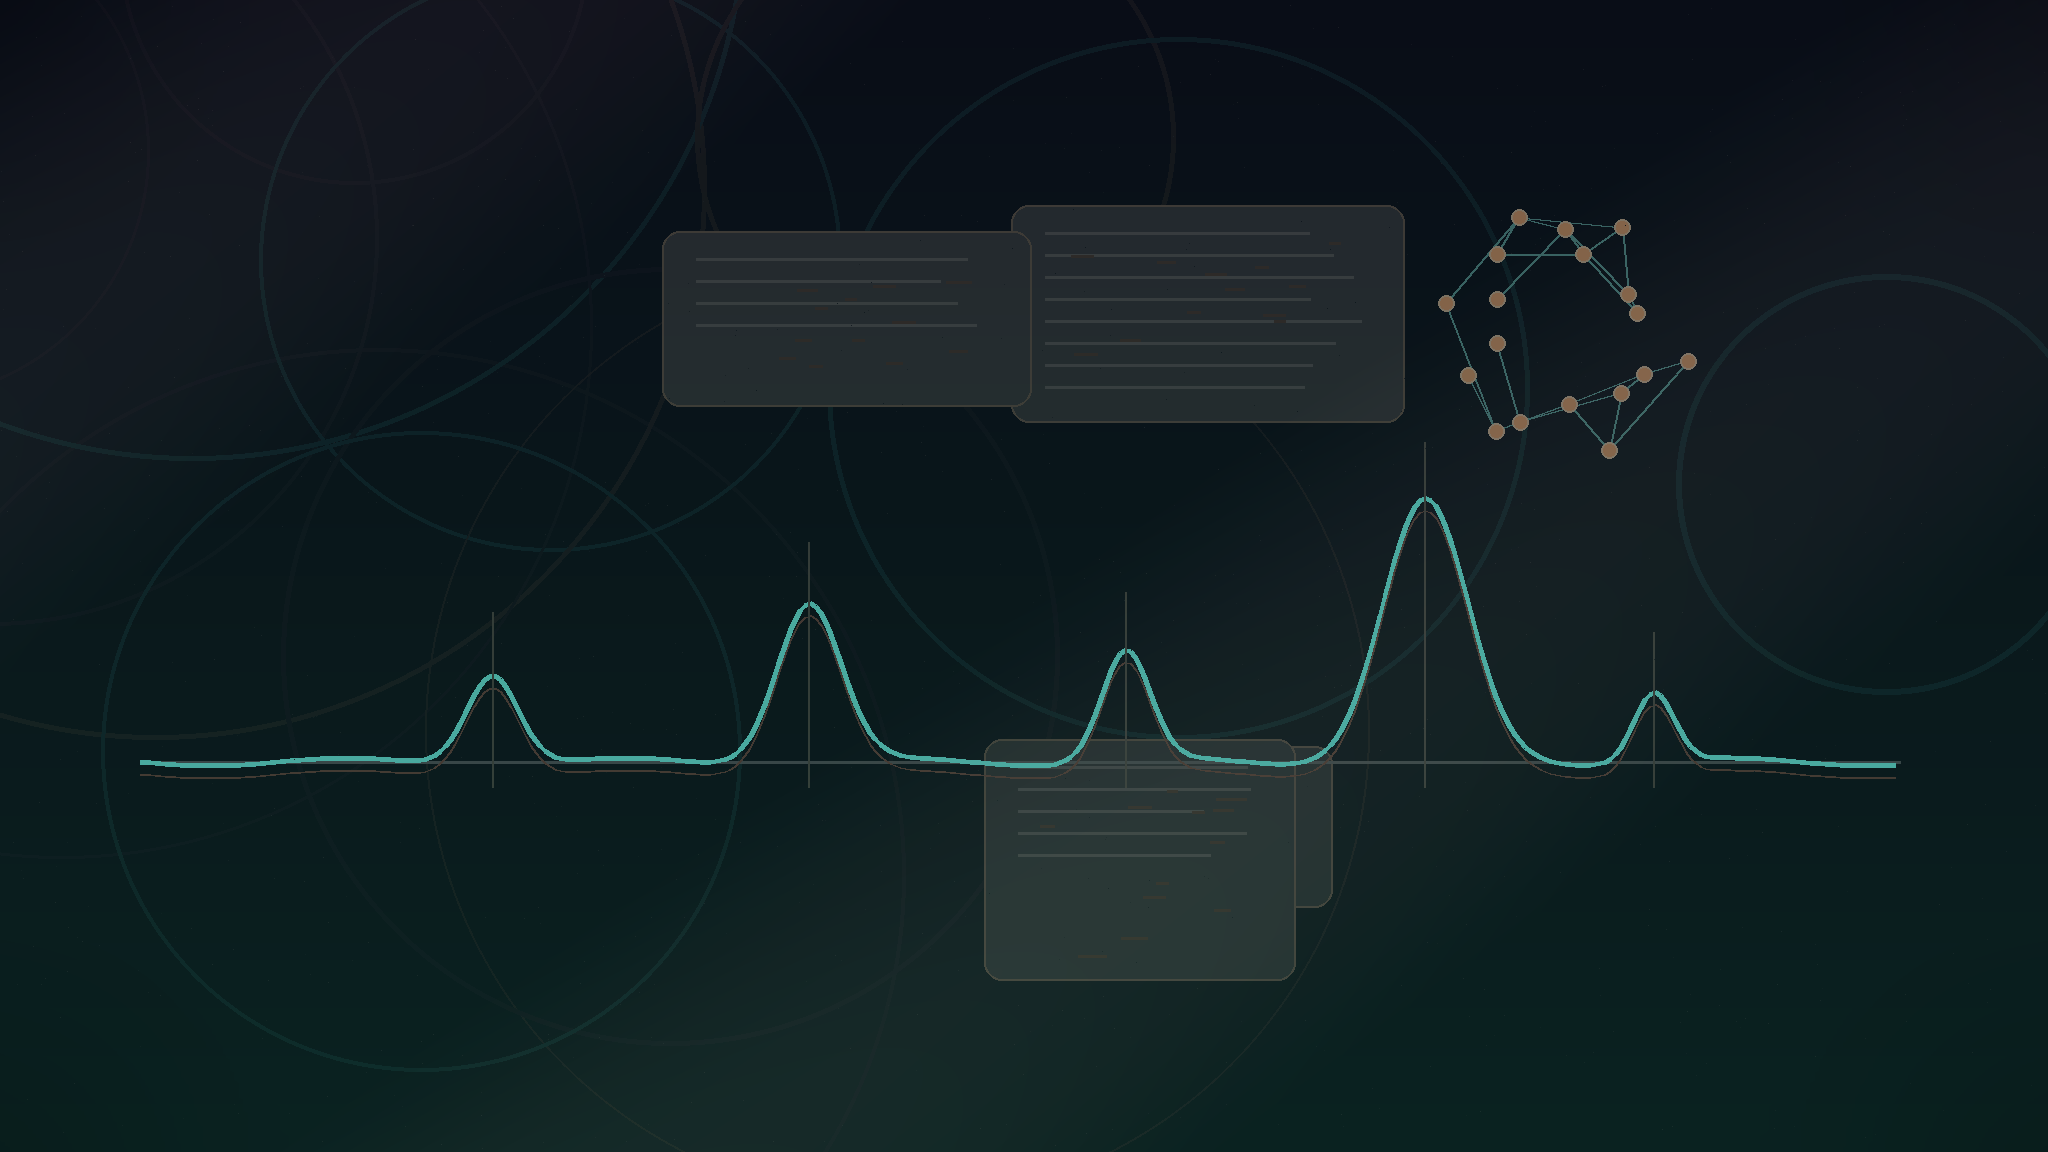
The baseline is the reference line from which peaks are measured. In a perfect teaching diagram, it is flat and quiet. In actual analytical records, baselines can drift, curve, step during a gradient, or contain low-level noise. Baseline handling matters because peak area is usually measured relative to that reference. A slightly different baseline choice can change calculated area percentages, especially for broad peaks, partially resolved peaks, or small signals near the detection limit.
Integration is the process of defining where each peak starts and ends, then calculating the area under the curve. Automated software can perform integration, but analysts may review or adjust integration events according to documented rules. This is a normal part of chromatography review. It becomes a documentation problem when integration choices are hidden, inconsistent, or used to make a trace appear cleaner than the underlying data supports.
For peptide documentation, area percent is commonly discussed as purity, but that shorthand should be handled carefully. Area percent is a chromatographic result under a particular detection method. It does not automatically account for water content, counterions, salts, non-UV-active components, or identity confirmation. It also does not explain sample custody or whether the tested sample came from the same lot being reviewed. Related Journal entries such as How to Read a Peptide Certificate of Analysis, HPLC vs. Mass Spectrometry, and Why a Single Purity Number Is Not the Whole Story cover those limits in more detail.
Questions to ask when reviewing a trace
A useful chromatogram review starts with the basics: compound name, lot number, sample date, method type, detector, column conditions, retention time, integration table, and raw trace. The goal is not to turn every researcher into a chromatography specialist. The goal is to avoid treating a polished graph as stronger evidence than it is.
- Does the report connect the trace to a specific lot number and sample source?
- Does it identify the method well enough for the result to be interpreted?
- Are the main peak, minor peaks, and integration table visible rather than summarized only as a headline number?
- Is there supporting identity information, such as mass spectrometry, when identity is part of the documentation question?
- Are any limitations stated plainly instead of converted into broad quality claims?
The strongest documentation stacks do not ask one chromatogram to answer every question. They combine manufacturer COAs, lot identifiers, analytical traces, mass confirmation where available, receiving records, and clear publication policies. Each record has a role. The chromatogram is especially useful for seeing how a sample behaved under a separation method, but it belongs inside a larger traceability and documentation review.
CRL materials are supplied for laboratory research use only. Chromatograms, COAs, and related documentation should be reviewed by lot, method, analytical scope, and custody context before being used in research documentation files.
Research Use Only
This product is supplied strictly for laboratory research workflows. It is not offered for food, drug, cosmetic, veterinary, agricultural, or household use. By purchasing, the buyer represents they are a qualified researcher and accepts all responsibility for proper handling, storage, and lawful research use.